For C-level executives, page speed is often dismissed as a purely technical metric relegated to IT departments. In reality, Core Web Vitals are a direct driver of commercial conversion and bottom-line revenue. A slow, sluggish digital experience doesn’t just lower your rankings in Google search; it inflates customer acquisition costs, tanks e-commerce checkout completion rates, and drains millions in lost revenue.
- The Direct Conversion Correlation: Google and Deloitte research proves that improving mobile page load times by just 0.1 seconds increases retail checkout conversions by 8.4% and order value by 9.2%.
- The INP Benchmark: Interaction to Next Paint (INP) measures responsiveness to clicks and taps. Heavy JavaScript frameworks that delay UI feedback beyond 200 milliseconds immediately depress user trust and mobile conversions.
- Ad Spend Synergy: Faster websites earn higher Quality Scores in Google Ads, reducing paid cost-per-click (CPC) by up to 25% while simultaneously capturing organic top-tier rankings.
The 3 Core Web Vitals Metrics Decoded for Executives
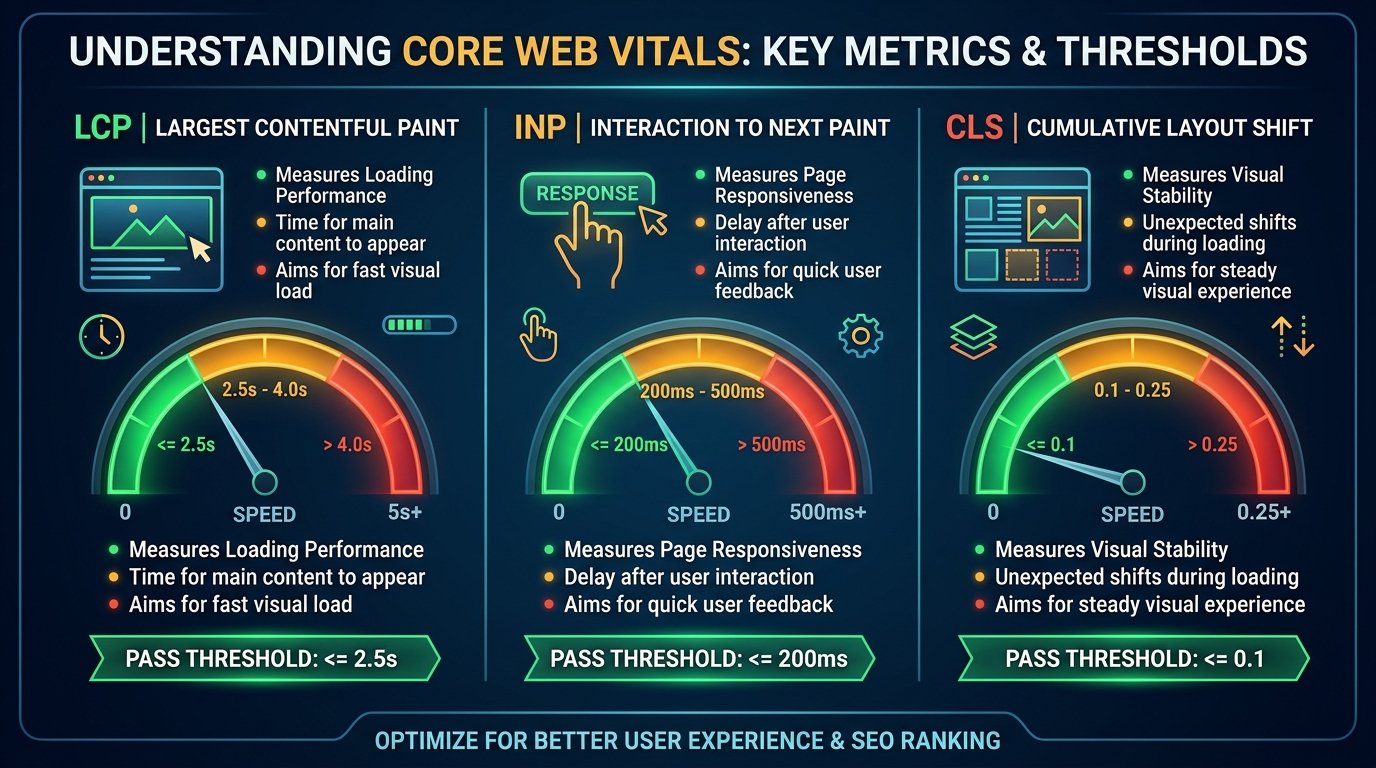
Google evaluates user experience using three standardized physical performance thresholds. Your website must achieve “Good” status across all three for at least 75% of real-world visits (CrUX data):
| Metric Name | What It Measures | Google “Good” Threshold | Direct Business Impact |
|---|---|---|---|
| Largest Contentful Paint (LCP) | Time taken to render the primary visual asset (hero image, video banner, or H1 headline). | ≤ 2.5 seconds | First impression bounce rate reduction; keeps mobile visitors on-page. |
| Interaction to Next Paint (INP) | Latency between a user’s tap, click, or keystroke and the next visual browser frame update. | ≤ 200 milliseconds | Mobile cart additions, filter responsiveness, and form submission completion. |
| Cumulative Layout Shift (CLS) | Visual stability score measuring unexpected page element movement during loading. | ≤ 0.1 score | Prevents accidental clicks on wrong buttons; eliminates checkout frustration. |
The 4 Major Engineering Bottlenecks & Solutions
1. Slow Time to First Byte (TTFB) Choking LCP
If your web server takes 1.5 seconds just to respond with the first byte of HTML, meeting the 2.5-second LCP benchmark is mathematically impossible. Resolve this by deploying edge caching via modern CDNs (Cloudflare Enterprise, Fastly, or AWS CloudFront), ensuring origin server response times stay under 300 milliseconds worldwide.
2. Unoptimized Hero Media and Responsive Images
Massive 4MB PNG or JPEG hero banners are the single most common cause of LCP failures. Implement modern image delivery pipelines:
- Convert all product and hero imagery to next-gen WebP or AVIF formats.
- Add explicit
fetchpriority="high"to your primary above-the-fold hero image. - Never apply lazy-loading (
loading="lazy") to the hero image; only lazy-load media positioned below the fold.
3. Tag Manager Script Bloat Paralyzing INP
Marketing teams frequently add dozens of third-party tracking pixels (Hotjar, TikTok, LinkedIn, Meta, Google Analytics) inside Google Tag Manager without IT oversight. These scripts lock the browser’s main JavaScript thread, causing the browser to freeze when a user clicks “Add to Cart”.
- Audit your GTM container and purge unused legacy tags.
- Shift heavy third-party tracking to Server-Side Tagging to execute analytics in the cloud rather than on the customer’s mobile browser.
- Break up long JavaScript tasks using
requestIdleCallback()orscheduler.yield().
4. Missing Image & Ad Dimensions Causing CLS
When browser engines render images, banners, or dynamic promotional bars without explicit width and height attributes, the layout abruptly shifts as the media finishes downloading, pushing text downward while a user is reading. Always reserve layout aspect ratios in CSS (aspect-ratio: 16 / 9;) before media elements load.
Turn Your Website Speed into a Revenue Multiplier
At SEO Sadhu, we don’t just optimize code for green Lighthouse scores; we optimize for real-world user speed and revenue lift. Our technical performance engineers identify and fix Core Web Vitals bottlenecks across enterprise CMS and headless architectures.
Frequently Asked Questions (FAQ)
What is the difference between Lab Data (Lighthouse) and Field Data (CrUX)?
Lab data (PageSpeed Insights / Lighthouse) is simulated in a synthetic, controlled test environment. Field data (Chrome User Experience Report / CrUX) represents actual real-world measurements from real users visiting your website over the past 28 days. Google’s ranking algorithm relies exclusively on Field Data when calculating rankings.
Why did Interaction to Next Paint (INP) replace First Input Delay (FID)?
FID only measured the delay of the very first click on a page. INP evaluates every interaction (clicks, taps, typing) throughout the entire user lifecycle on the page, capturing the worst responsiveness delays and providing a far more accurate assessment of real-world user frustration.
How long after fixing Core Web Vitals will Google update our Search Console status?
Because Field Data is calculated on a rolling 28-day window, you will see incremental improvements in Search Console within 14 days, with full validation and “Good” status recognition achieved after 28 consecutive days of improved user telemetry.